

Today’s post is for the programmers: it’s a bit technical. I finally solved a long-standing performance issue in Happy Usagi, and I thought I’d share my notes.
The issue
This was the problem: Happy Usagi was sometimes a bit jittery or choppy. The graphics weren’t entirely smooth, there was a little interruption every second or so. On newer computers it was barely noticeable, but on some older models it was a real issue. And the graphics aren’t complicated, so there really was no excuse.
Allegro and OpenGL
Usagi uses the Allegro game programming library. Allegro bundles a whole bunch of libraries for various aspects of games: sound, physics, joystick input, etc. For graphics, it depends on OpenGL (it can optionally use DirectX instead but that’s not relevant for this story).
Allegro wraps around OpenGL, and in effect hides its complexity. This is a double-edged sword. As long as everything goes smoothly Allegro makes things easy for the programmer. But when there is a bug, Allegro hides what is really going on. So you need a way to look under the hood.
Enter apitrace
Apitrace is an open source tool for tracking all the OpenGL calls done by your program. Installing apitrace on linux is as easy as:
sudo apt install apitrace apitrace-gui
To start recoding a trace:
apitrace trace --api gl build/debug/usagi
This generates a file named usagi.trace (or usagi.1.trace, usagi.2.trace etc.). You can view this file with
qapitrace usagi.trace
Which results in a screen like this:
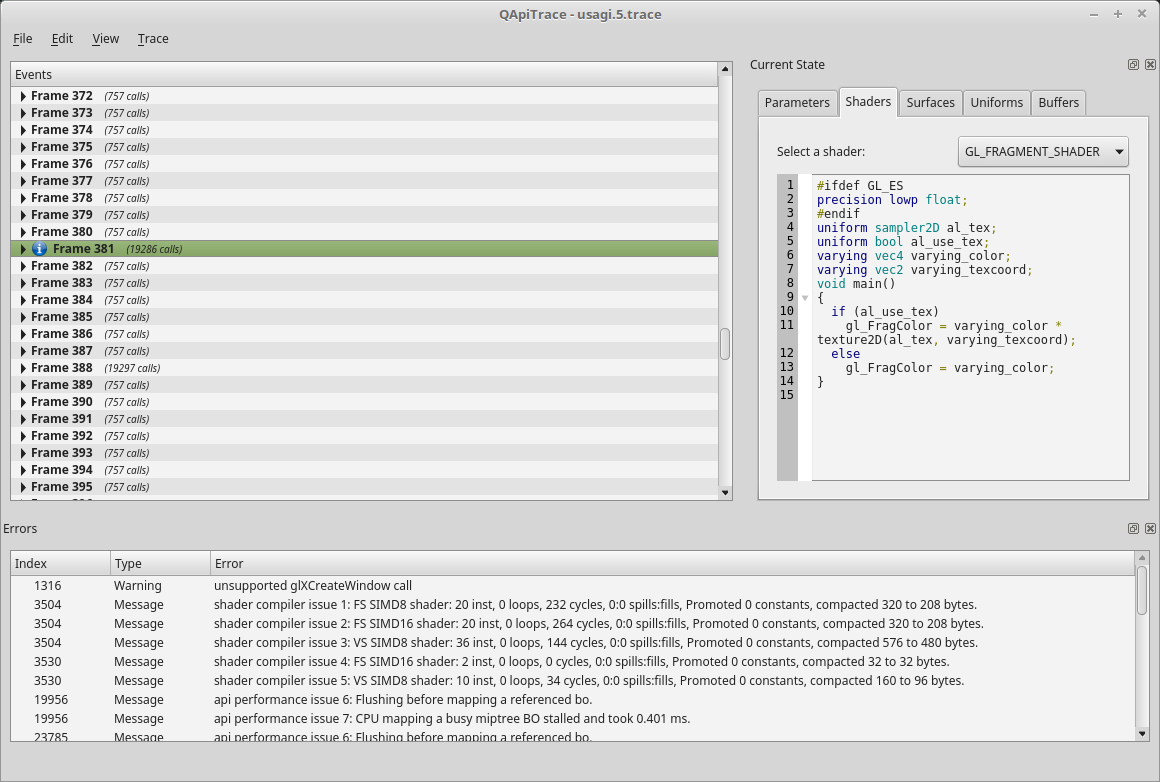
Each frame (drawing cycle), apitrace records all OpenGL calls. In the screenshot above, you see that nearly all frames consist of 757 calls. It makes sense that this number is constant from one frame to the next, because each frame, the game builds up the scene in exactly the same way: draw the background, draw the bunnies, draw the interface buttons. Most OpenGL functions perform communication with the graphics hardware, which is slow, so it’s important to keep this number as low as possible. 757 is probably a bit higher than I would like. Allegro adds a few extraneous calls that aren’t strictly necessary, but this is part of the trade-off between the ease of use of Allegro and the raw power of OpenGL.
What’s noticeable though, is that there are a few frames with crazy high numbers of OpenGL calls. 19286 calls in one frame? Now that would certainly cause a jitter! Apitrace lets you examine these calls in detail, as in the screenshot below.
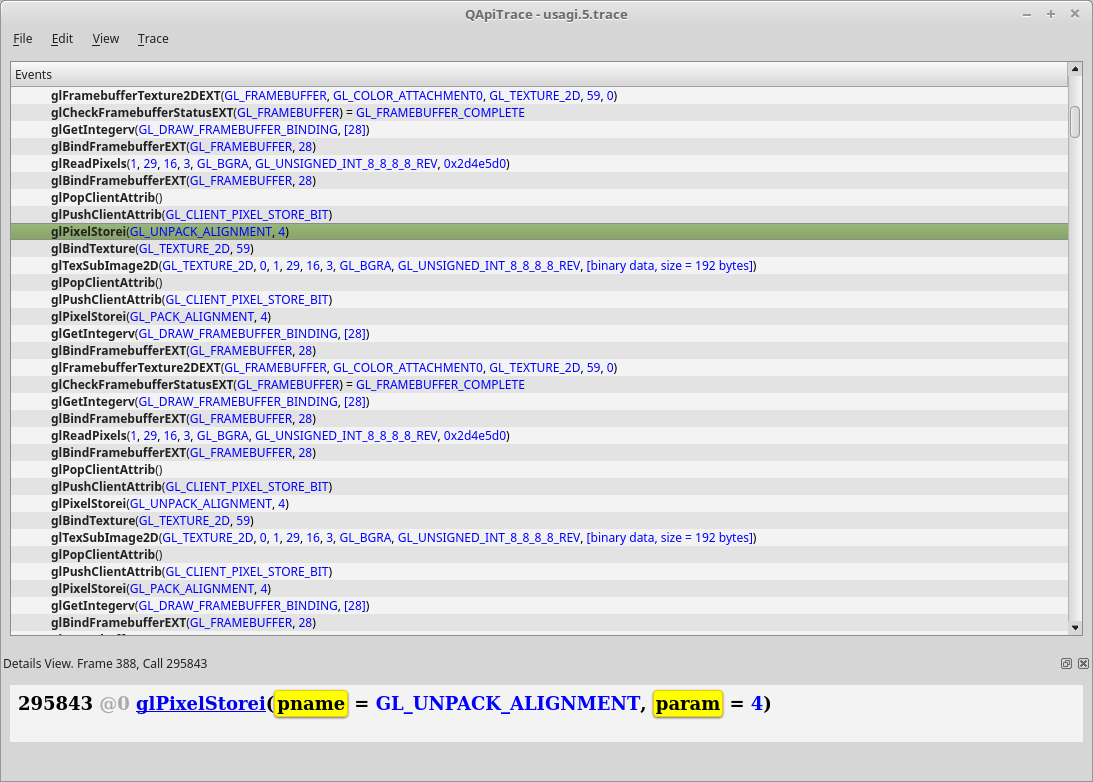
Looking through the calls in this bad frame, I notice a few that don’t occur in the good frames. For example, there are calls to glPixelStorei(). Although I don’t know exactly what it does, that doesn’t matter right now: the fact that it only occurs in the bad frame and not in the good frames makes it a suitable starting point for further investigation.
Zooming in further
So I open Usagi in the GNU debugger (gdb) and start tracking back from glPixelStorei
 gdb build/debug/usagi
 # Set a breakpoint on the glPixelStorei function
 (gdb) b glPixelStorei
 # Start the program
 (gdb) r
 starting program build/debug/usagi
 Thread 1 "usagi" hit Breakpoint 1 in glPixelStorei ()
          from /usr/lib/x86_64-linux-gnu/mesa/libGL.so.1
Ah great, it worked! I caught the program red-handed exactly in the middle of a bad frame. Now I just have to trace back to the origin of the problem, literally, using the “backtrace” command:
(gdb) bt
 #0 0x00007ffff4307980 in glPixelStorei ()
....
 #12 0x00007ffff67b3475 in al_draw_bitmap_region
 #13 0x00000000004518b6 in blitRow
 #14 0x0000000000451d3c in Bitmap::TiledBlit
 #15 0x0000000000469979 in Button::doDraw
 #16 0x0000000000467277 in Widget::updateBuffer
 #17 0x0000000000467092 in Widget::draw
 #18 0x0000000000460546 in Container::draw
Here you see the chain of function calls that led to glPixelStorei. You have to know the code to be able to interpret this, but I can see right away that the call to Button::doDraw was completely unexpected and unnecessary. Buttons are drawn on a back buffer that is only redrawn whenever the button changes state. In the game, buttons may be enabled or disabled depending on how much money you have. For example, the “buy a block” button becomes available when you have earned enough money to buy that block. And money changes every second or so. Suddenly all the pieces fall into place: due to a mistake the game was redrawing all the buttons, every time your money counter changes, which is complete overkill.
There is more. Why does the redraw of a button cause such a crazy high number of OpenGL calls? It turns out that the button was copied from System memory to Video memory, a big performance no-no.
It’s funny how a really difficult bug becomes really easy to solve with the right toolset. I’ve known about the jitteriness for a long time, but couldn’t figure out what to do about it. Until I started using apitrace. Once you know exactly where the problem is, the solution is trivial. In the end it took about four lines of code to fix the main performance issues.
New Release of Happy Usagi
These fixes are important enough to immediately released them. Version 0.3 of Happy Usagi can be download here.